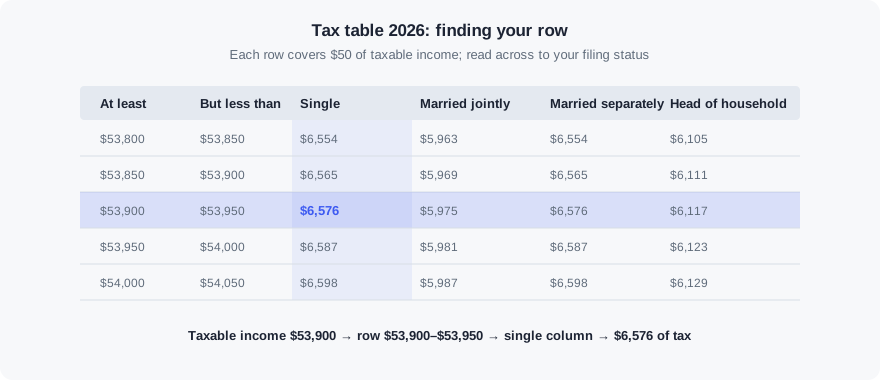
Use the tax table 2026 lookup below to find your federal income tax on any taxable income under $100,000. Enter your taxable income and filing status to find your row: the lookup shows your tax plus the rows around it, laid out like the table in the Form 1040 instructions.
1
Look up your row
Taxable income from Form 1040 line 15.
ⓘ
Your row reads “at least $53,900 but less than $53,950”. Go across to the single column.
2
2026 Tax Table result
Single
YOUR TAX IS$6,576.00Enter this on Form 1040 line 16 if you have no qualified dividends or capital gains
At least
But less than
Single
Married jointly
Married separately
Head of household
$53,650
$53,700
$6,521
$5,945
$6,521
$6,087
$53,700
$53,750
$6,532
$5,951
$6,532
$6,093
$53,750
$53,800
$6,543
$5,957
$6,543
$6,099
$53,800
$53,850
$6,554
$5,963
$6,554
$6,105
$53,850
$53,900
$6,565
$5,969
$6,565
$6,111
$53,900
$53,950
$6,576
$5,975
$6,576
$6,117
$53,950
$54,000
$6,587
$5,981
$6,587
$6,123
$54,000
$54,050
$6,598
$5,987
$6,598
$6,129
$54,050
$54,100
$6,609
$5,993
$6,609
$6,135
$54,100
$54,150
$6,620
$5,999
$6,620
$6,141
$54,150
$54,200
$6,631
$6,005
$6,631
$6,147
Rows are calculated from the 2026 rate schedules in IRS Revenue Procedure 2025-32by taxing each row's midpoint and rounding to the dollar, the method the IRS uses to print the table.
IRS Revenue Procedure 2025-32All four filing statusesFree lookup
2026 TAX TABLE
2026 Tax Table Excerpt: Tax at Every $5,000
One $50 row from every $5,000 of taxable income. Use the lookup above for any other amount.
At least
But less than
Single
Married filing jointly
Married filing separately
Head of household
$5,000
$5,050
$503
$503
$503
$503
$10,000
$10,050
$1,003
$1,003
$1,003
$1,003
$15,000
$15,050
$1,555
$1,503
$1,555
$1,503
$20,000
$20,050
$2,155
$2,003
$2,155
$2,049
$25,000
$25,050
$2,755
$2,507
$2,755
$2,649
$30,000
$30,050
$3,355
$3,107
$3,355
$3,249
$35,000
$35,050
$3,955
$3,707
$3,955
$3,849
$40,000
$40,050
$4,555
$4,307
$4,555
$4,449
$45,000
$45,050
$5,155
$4,907
$5,155
$5,049
$50,000
$50,050
$5,755
$5,507
$5,755
$5,649
$55,000
$55,050
$6,818
$6,107
$6,818
$6,249
$60,000
$60,050
$7,918
$6,707
$7,918
$6,849
$65,000
$65,050
$9,018
$7,307
$9,018
$7,449
$70,000
$70,050
$10,118
$7,907
$10,118
$8,307
$75,000
$75,050
$11,218
$8,507
$11,218
$9,407
$80,000
$80,050
$12,318
$9,107
$12,318
$10,507
$85,000
$85,050
$13,418
$9,707
$13,418
$11,607
$90,000
$90,050
$14,518
$10,307
$14,518
$12,707
$95,000
$95,050
$15,618
$10,907
$15,618
$13,807
HOW TO USE IT
How to Read the 2026 Tax Table
Find the row that contains your taxable income, then read across to your filing status.
Find taxable income on Form 1040 line 15, after your standard or itemized deduction
Find the row where that amount is at least the first column and less than the second
Read across to the column for your filing status
Enter that amount on Form 1040 line 16, unless you have qualified dividends or capital gains
A single filer with $53,900 of taxable income uses the $53,900–$53,950 row and owes $6,576. A married couple filing jointly with the same taxable income owes $5,975, because their brackets are twice as wide. Not sure of your taxable income? The 2026 standard deduction page shows what to subtract from AGI.
TABLE VS BRACKETS
Tax Table vs Tax Brackets
The table is built from the brackets, so both give nearly the same tax. The difference is that the table taxes the middle of each row. At $53,900 the table shows $6,576, while exact bracket math gives $6,570.00. The gap is never more than a few dollars, and the table amount is the one the IRS expects on your return.
The table in the Form 1040 instructions that gives the tax on taxable income under $100,000. Each row covers a $50 range (narrower at the very bottom) and shows the tax for single, married filing jointly, married filing separately and head of household filers, so you can read your tax instead of working through the brackets.
When will the IRS release the 2026 tax table?+
It is printed in the 2026 Form 1040 instructions, which the IRS publishes around the end of 2026 for returns filed in 2027. The amounts here are calculated from the 2026 rate schedules in IRS Revenue Procedure 2025-32 using the same midpoint method, so they match the official table.
I'm filing my 2025 return. Is this the right table?+
No. A 2025 return uses the 2025 Tax Table in the 2025 Form 1040 instructions. The table on this page is for tax year 2026, the return due in April 2027, and for estimating 2026 withholding.
Is the tax table based on gross income?+
No, on taxable income: Form 1040 line 15, after the standard or itemized deduction. A single filer earning $70,000 with the $16,100 standard deduction looks up $53,900.
Why is the tax table a few dollars different from a bracket calculator?+
The table taxes the midpoint of each $50 row and rounds to the dollar. At $53,900 the table shows $6,576 while the exact bracket math gives $6,570.00. Use the table figure on your return.
What if my taxable income is $100,000 or more?+
The Tax Table stops below $100,000. From there you use the Tax Computation Worksheet, which gives the exact bracket result: income times your top rate, minus a fixed subtraction amount.